FinanceMap’s 2025 assessment of the Canadian Big Five banks’ (Royal Bank of Canada, TD Bank, Scotiabank, Bank of Montreal, and Canadian Imperial Bank of Commerce) 2020–2024 lending and underwriting activities finds that the banks show persistent high exposure to the fossil fuel sector, particularly high-cost domestic oil and gas producers, while having limited relative exposure to green companies. This sets the Canadian banks apart from their global peers, and appears to expose them to elevated financial risks associated with the energy transition.
In 2024, the Big Five provided $131 billion (USD) in financing to fossil fuel companies, making up 18.3% of their total financing portfolios. This is more than twice the relative exposure of top US banks (7.8%) and over three times that of European peers (6.0%). The Canadian banks’ fossil fuel financing consisted of 71% in loan deals and 29% in bond and equity underwriting deals.
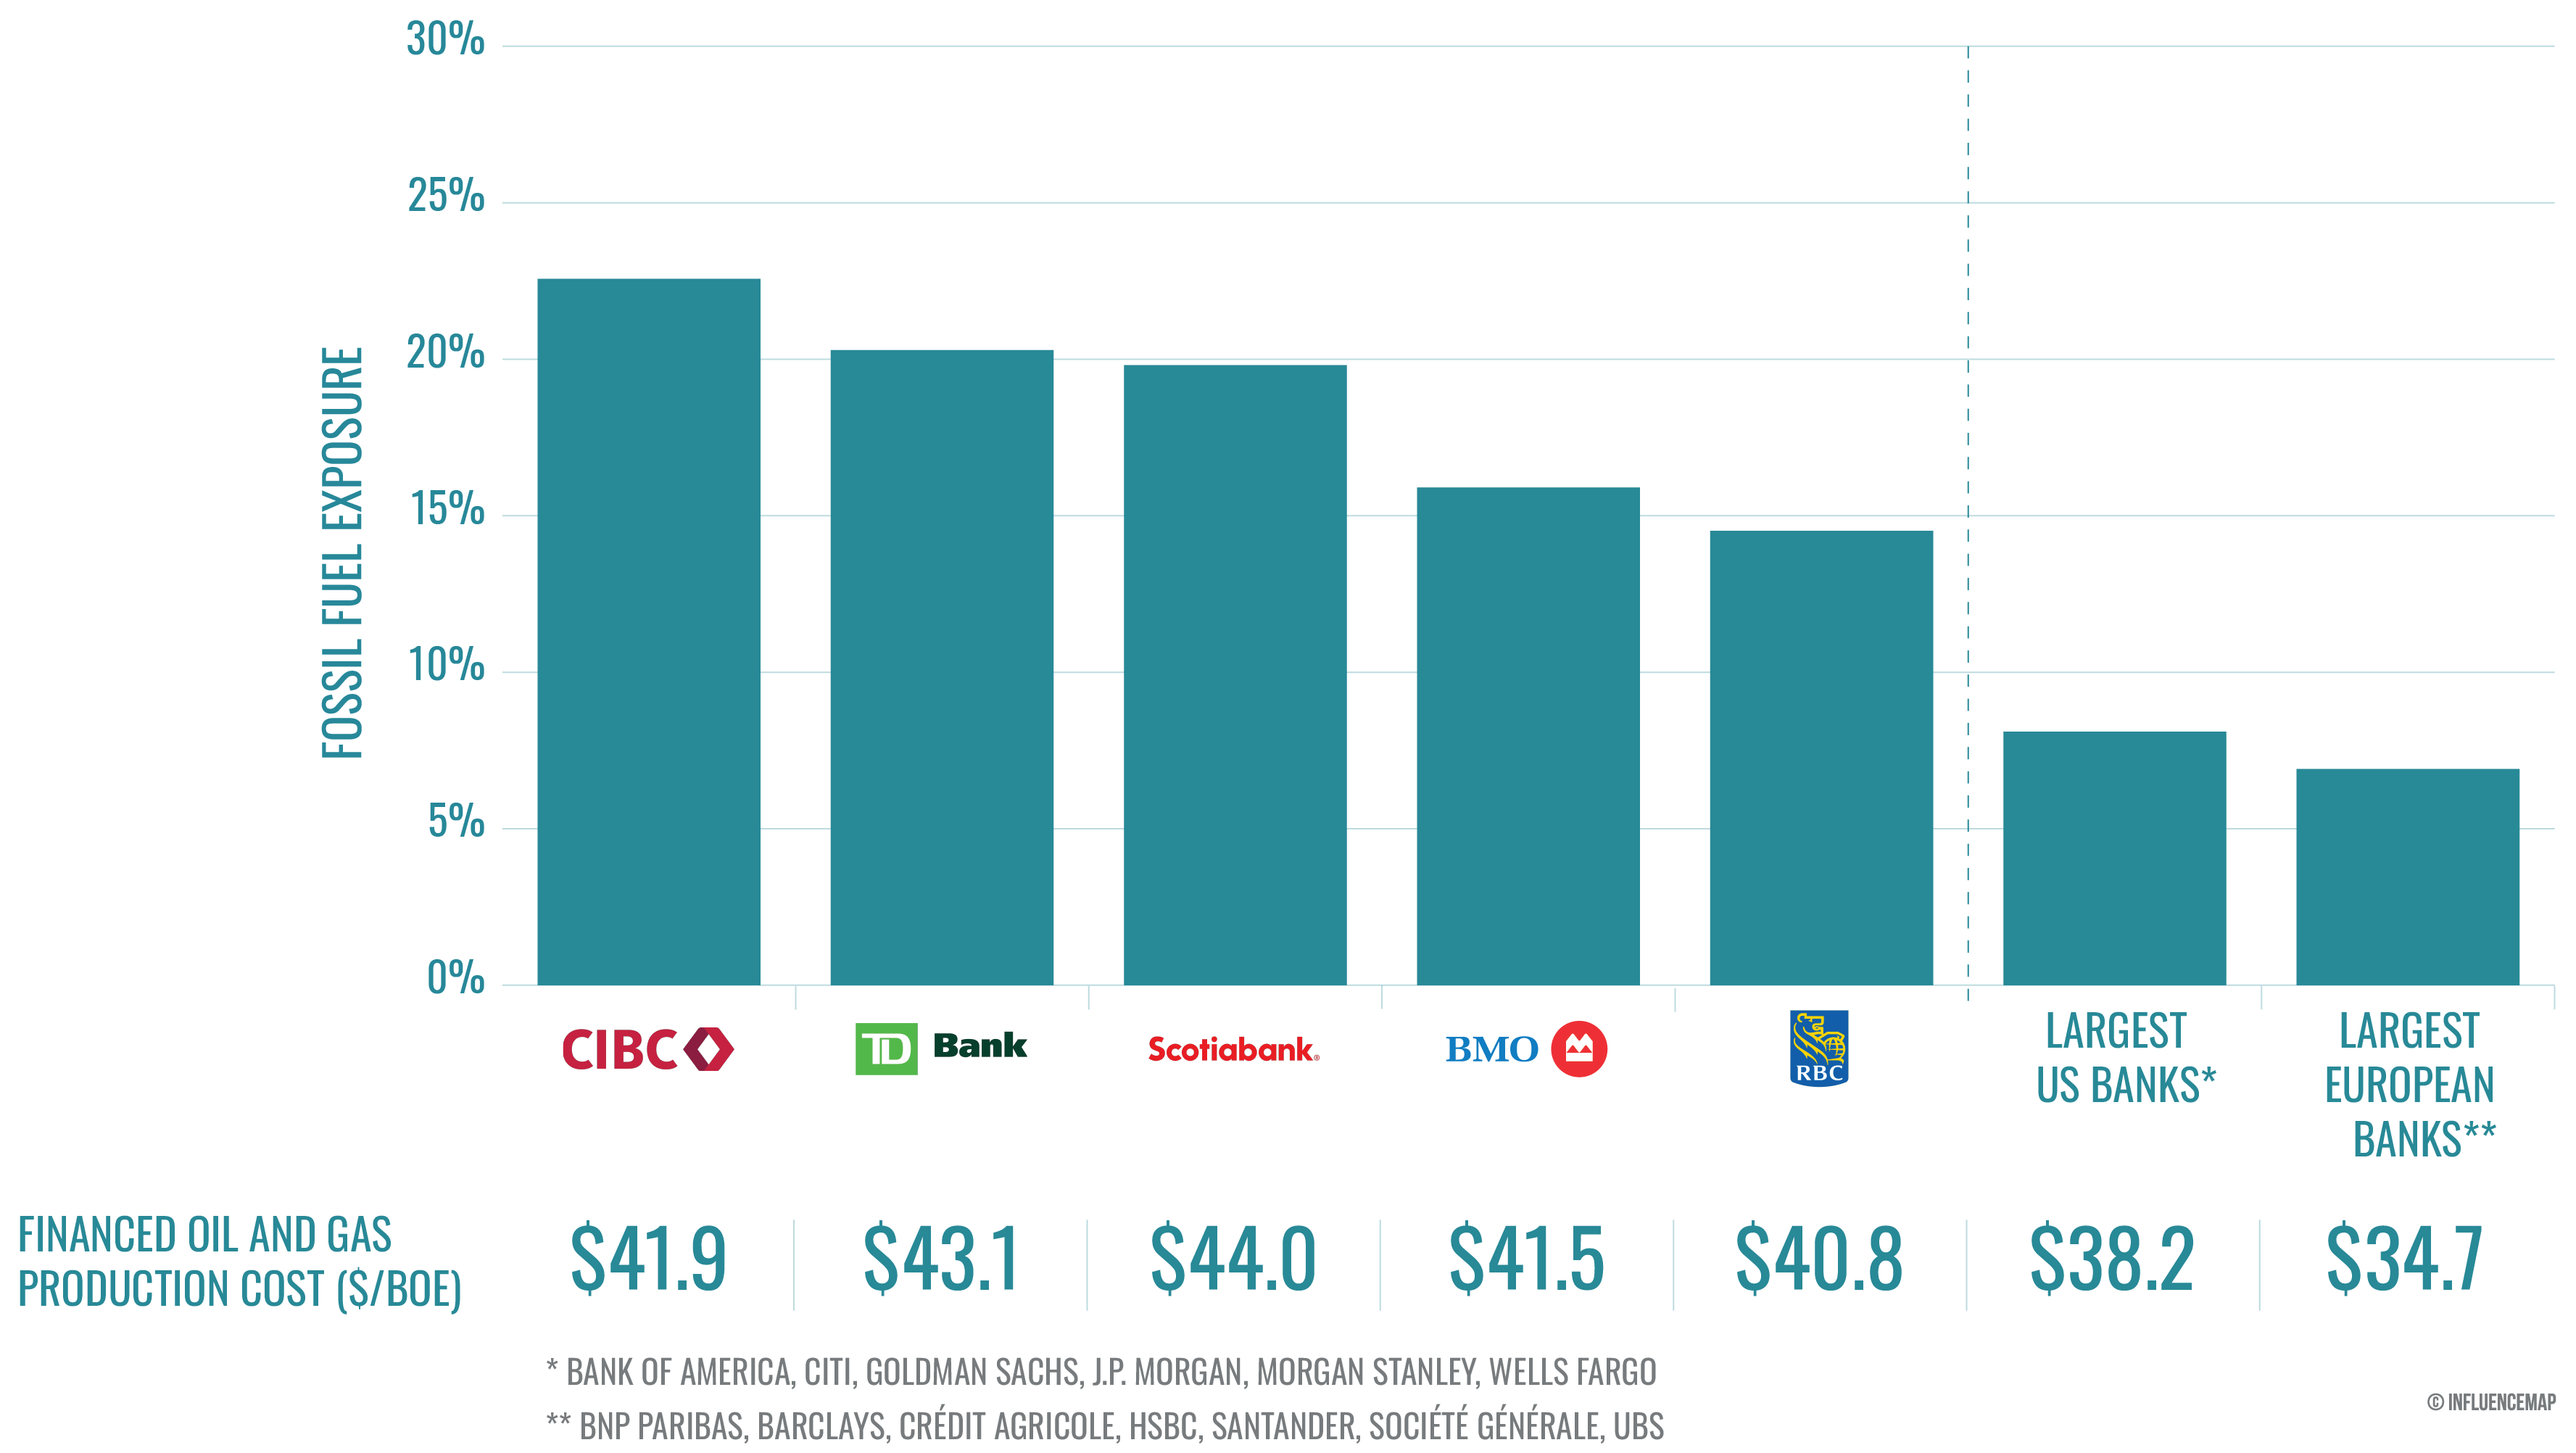
Over two thirds of the Big Five’s fossil fuel financing went to Canadian oil and gas companies. Carbon Tracker Initiative data shows that these domestic companies are less cost competitive than other companies globally, exposing them to higher financial risk in a net-zero transition when declining oil and gas demand drives prices down.1. The average oil and gas company financed by the Big Five between 2020 and 2024 had a breakeven point of oil and gas production 11% greater than those financed by the largest US banks and 22% greater than those financed by the top European banks. Meanwhile, the extraction and processing of Canadian crude oil has been linked to 3.1 times higher greenhouse gas emissions than the global average barrel of crude.2
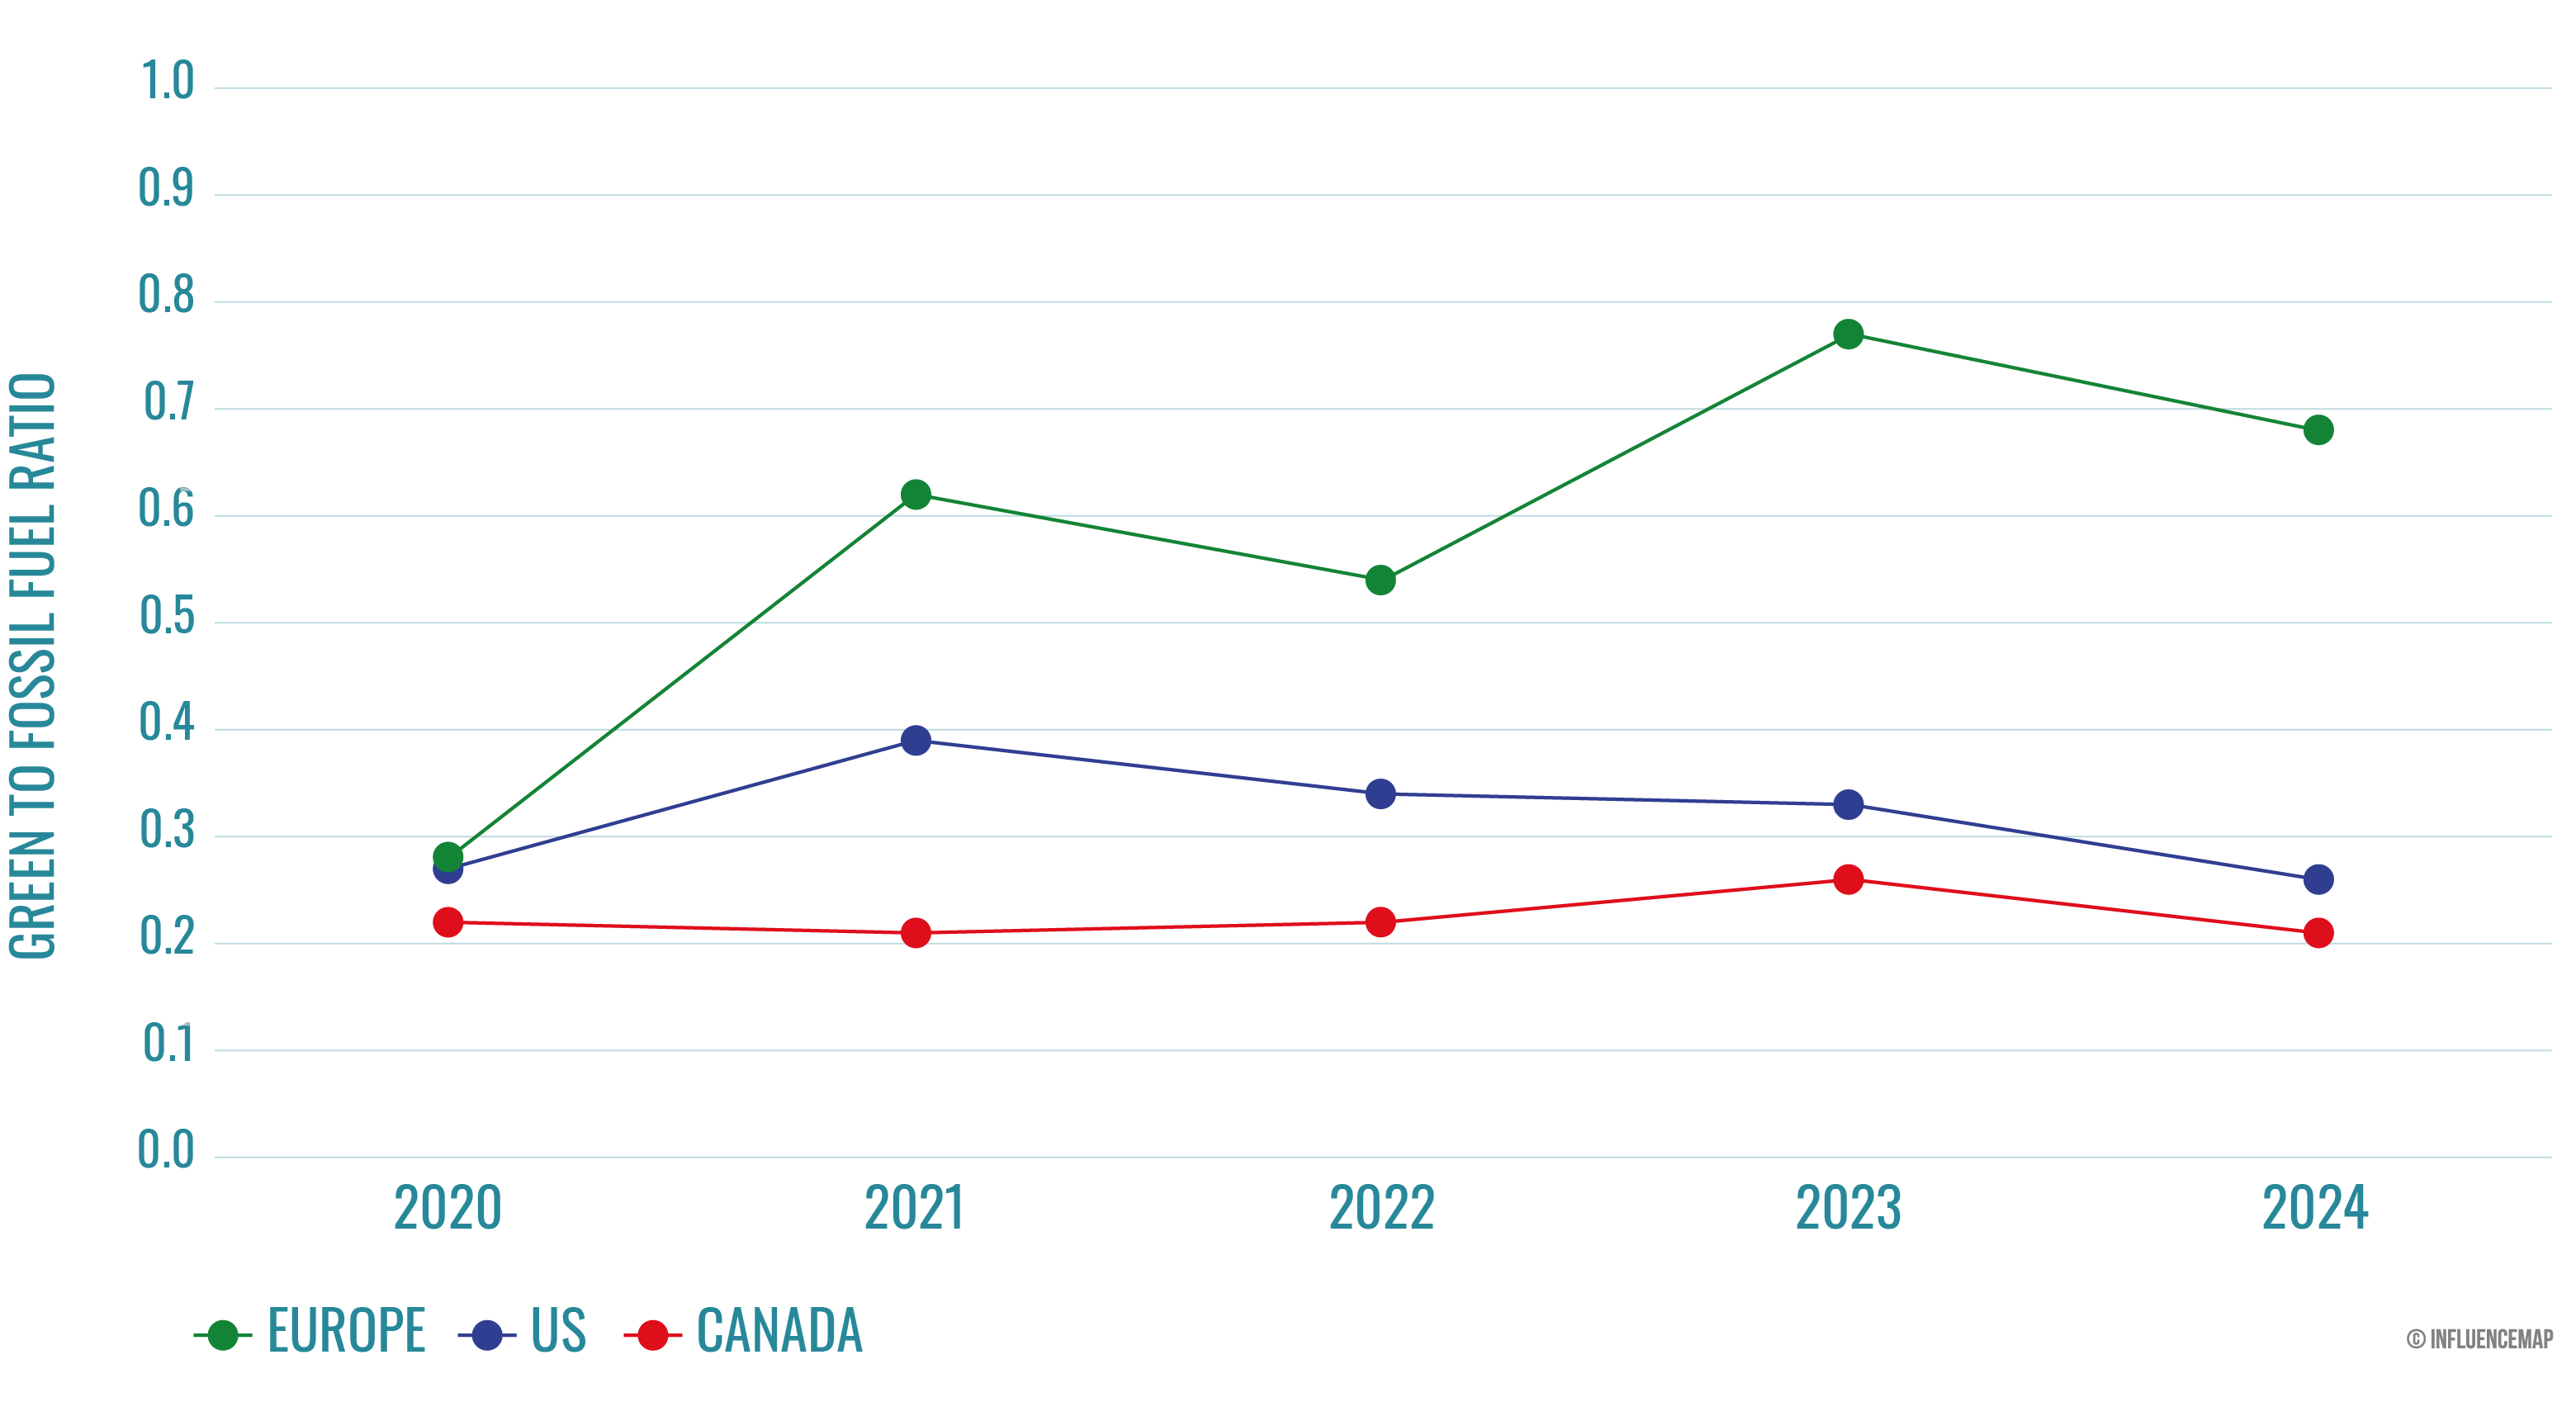
The Big Five’s green financing remains limited, consisting of just $27.9 billion in 2024, equivalent to 3.9% of the banks’ total 2024 financing portfolios. The Canadian banks perform similarly on relative green exposure to their largest European counterparts while outperforming the top US banks. However, in 2024, the Big Five averaged just $0.21 in green financing for every $1 in fossil fuel financing, substantially below the 0.68:1 ratio achieved by top European banks. This places Canada’s largest banks far off track to reach a 4:1 green to fossil fuel financing ratio by 2030, estimated by BloombergNEF to align with a 1.5°C scenario.
1 Carbon Tracker Initiative, Paris Maligned III, April 2025.
2 Carnegie Endowment for International Peace, Oil-Climate Index, 2016.
This report reveals the persistent high levels of fossil fuel financing by Canada's five biggest banks. The banks' continued support for high-cost domestic oil and gas production is putting the country's financial sector on the back foot in the energy transition compared to its international peers. Prime Minister Mark Carney recognized the risks of such an approach himself ten years ago, warning that if policymakers and the financial sector do not account for climate risks now, the eventual costs will be much larger.
This report confirms that Canada's big banks are not just lagging on climate action, they are actively contributing to the acceleration of the climate crisis. They are making riskier bets than their European and even American counterparts - not only jeopardizing our economy but also actively slowing the transition to clean energy. The recent wave of catastrophic fires and floods should be a final warning. This data is a blaring call for stronger financial regulation to end this reckless gamble with our future.
FinanceMap is a research program by global climate change think tank InfluenceMap. Metrics and analysis featured in this report are available in full at financemap.org. All financial institutions assessed in this research were offered the opportunity to review the analysis and provide feedback prior to release.
The Canadian government has set out high-level commitments to tackle climate change over the past years, most notably to achieve net zero emissions by 2050 through the Canadian Net-Zero Emissions Accountability Act of June 2021. However, Canada has a high level of dependence on its oil and gas sector due to its historic role as one of the country’s primary economic sectors, leading to considerable transition risk as the global economy moves away from fossil fuels. As such, the importance of an orderly transition for the country is high, and the Canadian banking sector will play a key role in facilitating this transition through its financing and services provided to the real economy.
FinanceMap’s March 2024 report Canada's Big Five Banks: Heading to Net Zero? found that despite setting net-zero commitments, Canada’s five largest banks—Royal Bank of Canada, TD Bank, Scotiabank, Bank of Montreal, and Canadian Imperial Bank of Commerce—were undermining their own climate targets through their financing activities, lack of robust sector financing policies, and inconsistent government policy engagement. In particular, the report noted that the banks’ fossil fuel financing was highly misaligned with IEA and IPCC net-zero pathways. It found that the Big Five banks had steadily increased their fossil fuel financing exposure from an average of 15.5% in 2020 to 18.4% in 2022. This compared with an average of 6.1% for leading US banks and 8.7% for European banks across the 2020–2022 period. Meanwhile, just 4.3% of the Canadian banks’ 2020–2022 financing flows went to companies identified as green. These activities appeared at odds with the banks’ climate commitments set directly and through their membership to the Net Zero Banking Alliance (NZBA). In January 2025, all Big Five banks left the NZBA.
This report provides an update to FinanceMap’s analysis of the Canadian Big Five banks’ financing flows by including financing deal data up to the end of 2024 for all five banks. The research seeks to assess the climate-related performance of the banks’ financing flows through analysis of the climate alignment and cost competitiveness of their fossil fuel and green financing activities, as well as to compare this to the performance of the banks’ US and European peers.
FinanceMap’s banking portfolio analysis assesses the climate performance of financing facilitated by banks through their corporate lending and bond and equity underwriting activities. The portfolios assessed here include deals between 1st January 2020 and 31st December 2024. Deal data has been gathered from Bloomberg Terminal LEAG tables. All financing values assessed are in USD.
The universe of banks assessed in this report consists of Canada’s five largest banks by total assets (the ‘Big Five’), as well as the largest banks by total assets in the US and Europe for comparative purposes:
This report uses four metrics to assess the banks’ financial portfolios:
The green and fossil fuel exposure metrics assess the ratio of deal value financed to companies in each category to a bank’s total portfolio value. Green companies are identified using the EU taxonomy for sustainable activities, with companies being classified as green if they derive over 75% of total revenue from activities defined as substantially contributing to climate change mitigation under the taxonomy. Fossil fuel companies are defined as those companies having primary business activities within the fossil fuel production value chain, identified using the company sector classifications BICS, NAICS, and GICS. Dividing a portfolio’s green exposure by its fossil fuel exposure gives the green to fossil fuel financing ratio.
The average financed breakeven point of oil & gas production is calculated using results from the Carbon Tracker Initiative’s least-cost modelling of upstream oil & gas assets, based on asset-level supply and economic data from Rystad Energy. This data assesses the minimum price per barrel of oil equivalent ($/boe) an oil and gas asset needs to cover its capital and operating costs, i.e. the asset's breakeven price. Carbon Tracker's modelling identifies which potential assets worldwide would be economically viable under various future demand scenarios, including the International Energy Agency’s Stated Policies Scenario (STEPS) scenario. For application in this work, we include assets viable under STEPS and exclude high-cost assets unlikely to be sanctioned, to avoid inflating financed breakeven points. Asset breakeven data for the selected projects is aggregated to the oil and gas company level. Each bank’s average financed breakeven point is then calculated as the weighted average of the breakeven points of the oil and gas companies in its deal portfolio, weighted by deal value.
Table 1 shows the total identified deal value for the Big Five Canadian banks’ financing to companies in the fossil fuel production value chain in 2024 and their fossil fuel exposure relative to their full assessed 2024 deal portfolio. The same data is shown for the Big Five’s combined portfolios and for the combined portfolios of their largest peers in the US and Europe.
| Bank(s) | Fossil Fuel Financing ($ bn) | Fossil Fuel Exposure |
|---|---|---|
| TD Bank | 36 | 0.222 |
| RBC | 29 | 0.134 |
| BMO | 23 | 0.159 |
| Scotiabank | 22 | 0.207 |
| CIBC | 21 | 0.241 |
| Big 5 Canadian banks (total) | 131 | 0.183 |
| Top US banks (total)4 | 204 | 0.078 |
| Top European banks (total)5 | 69 | 0.06 |
This research identifies $131 billion in deal value financed by the Canadian Big Five banks to fossil fuel companies in 2024, consisting of 71% ($93 billion) in loan deals and 29% ($38 billion) in bond and equity underwriting deals. Deals with companies in the oil and gas value chain made up 97% ($127 billion) of the identified fossil fuel financing value, with the remaining 3% ($4 billion) going to the coal value chain.
CIBC had the highest relative exposure to the fossil fuel production value chain at 24.1% of its total portfolio, but the lowest absolute financing at $21 billion, while RBC had the lowest relative exposure at 13.4%. TD Bank had the highest absolute fossil fuel financing deal value at $36 billion.
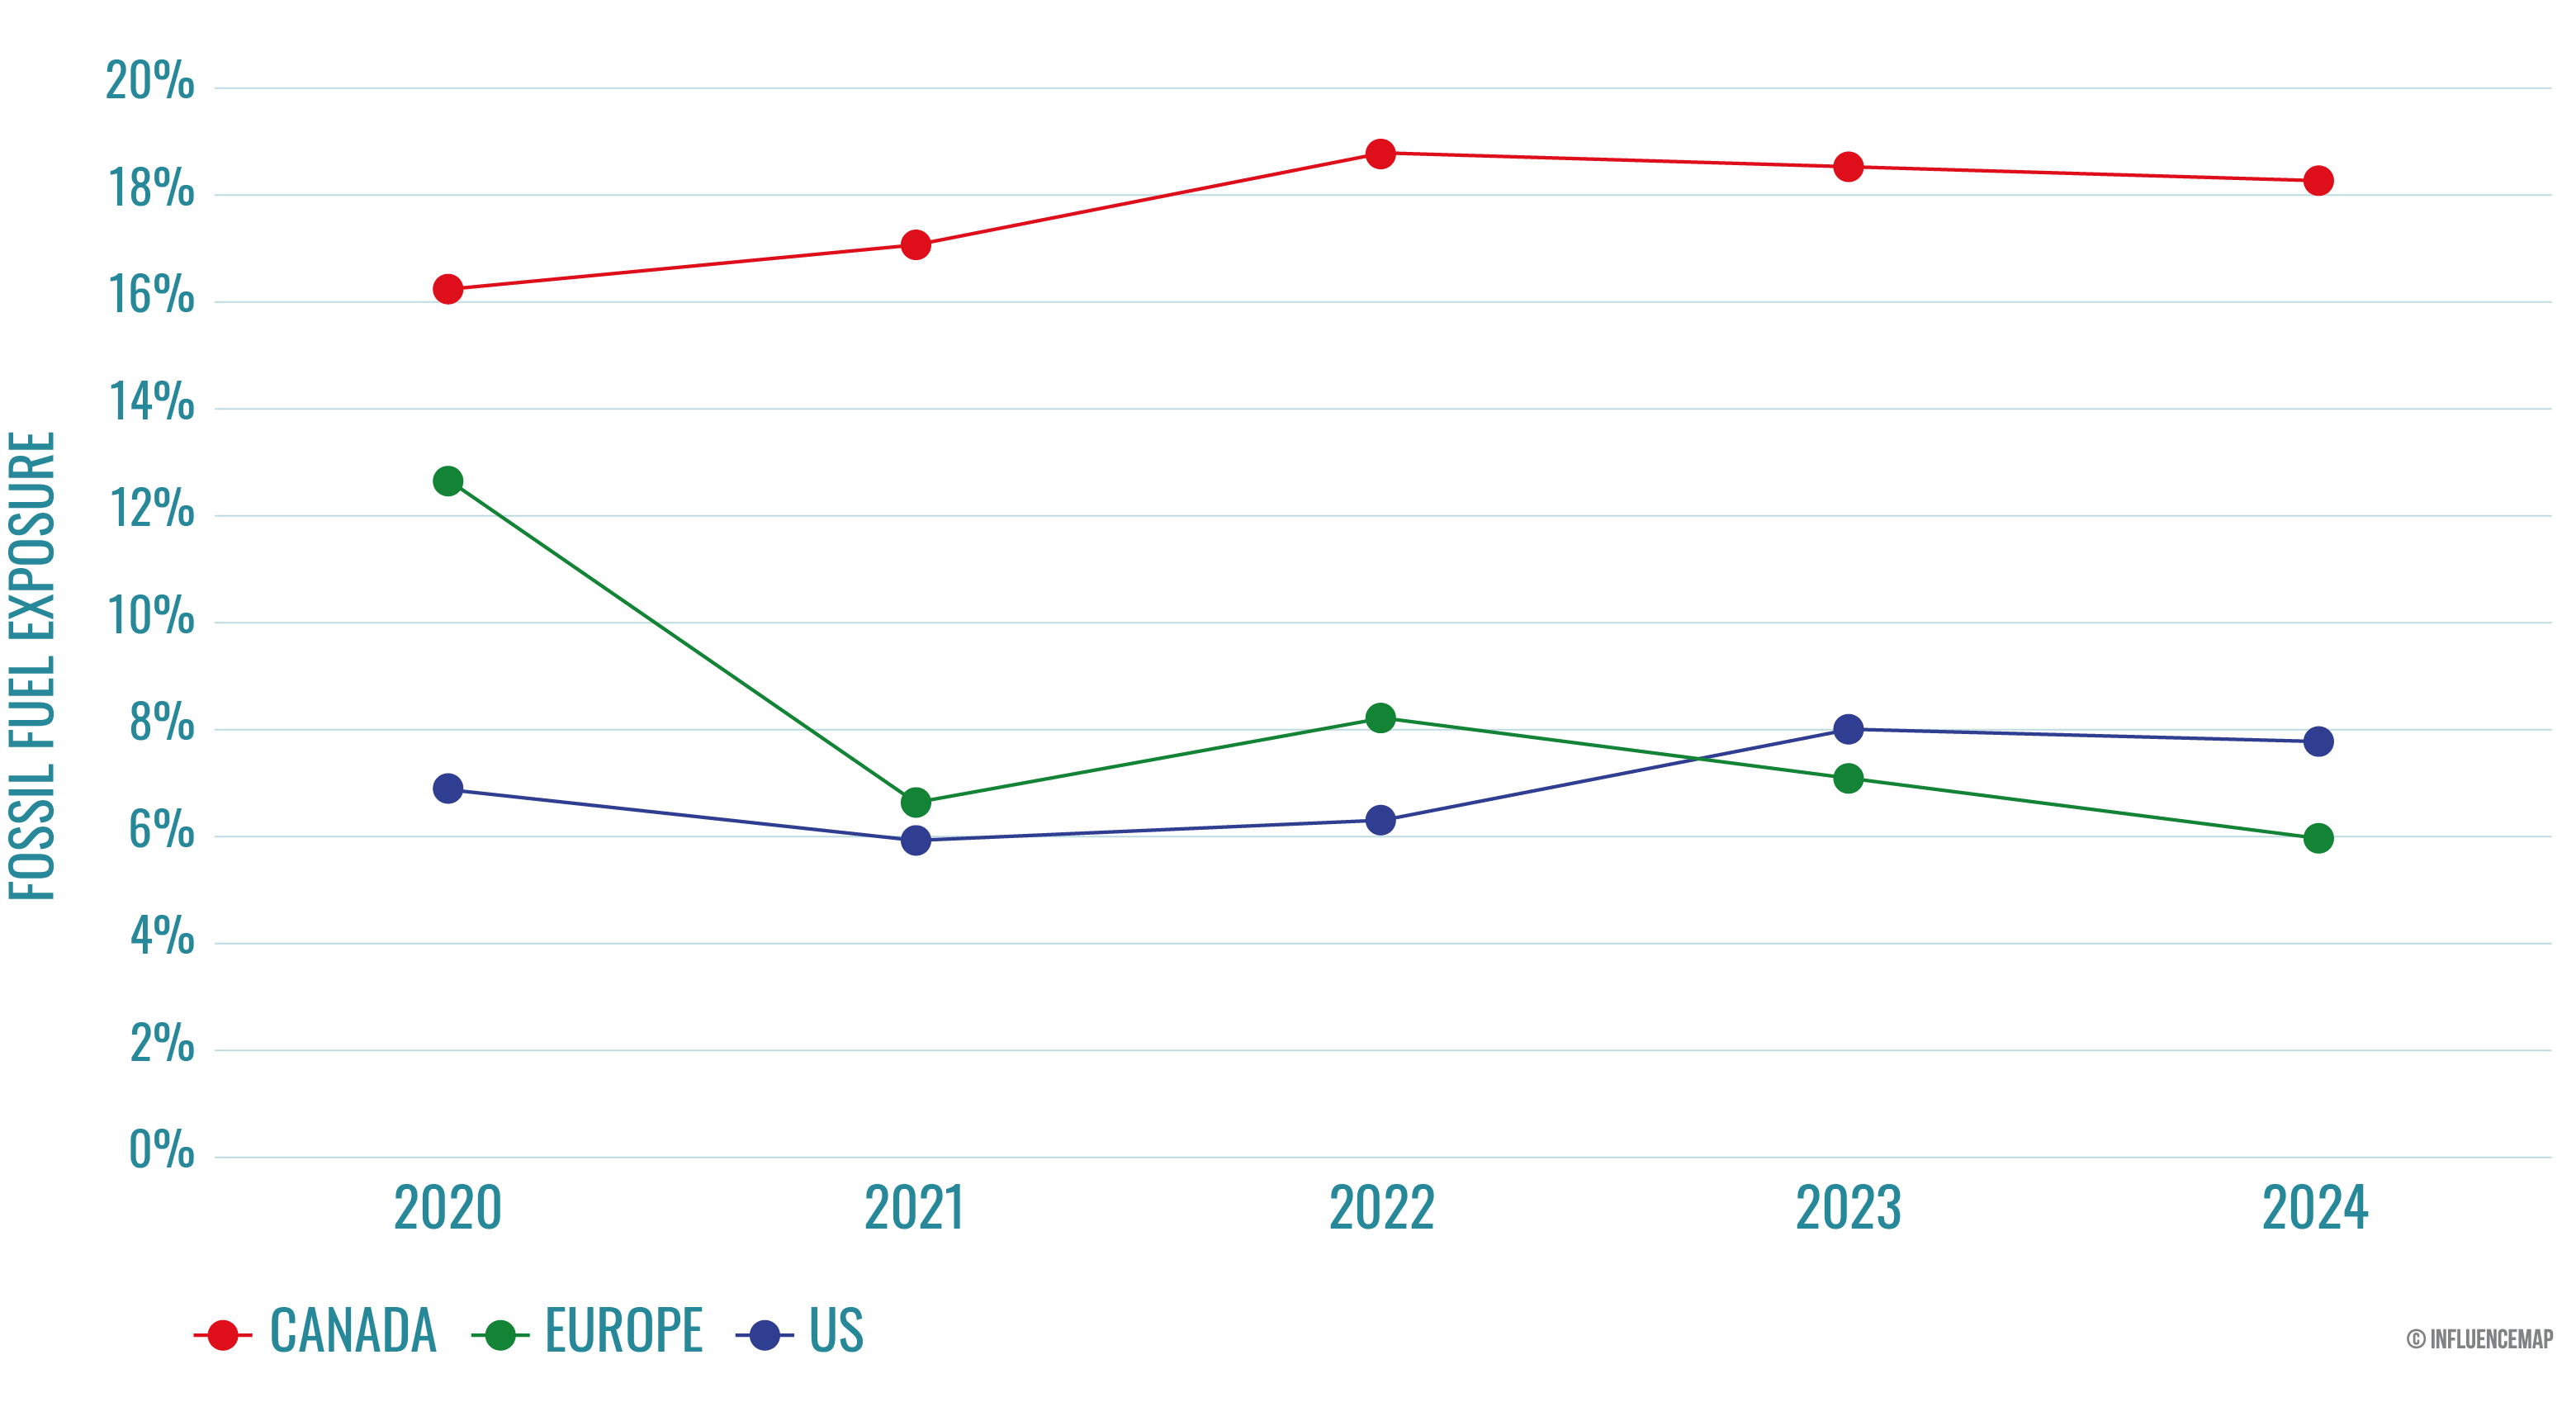
The five largest Canadian banks had substantially higher relative exposure to the fossil fuel sector in 2024 than the largest banks in the US and Europe. As demonstrated in Figure 4, this pattern has held true over the past five years. In 2024, relative to each region’s respective total financing value, the Canadian banks were 2.3 times more exposed to fossil fuels than the top US banks and 3.1 times more exposed than the largest European banks.
Table 2 shows the banks’ average financed breakeven point of oil and gas production between 2020 and 2024. The Canadian banks’ combined 2024 financing portfolio has an average financed breakeven point of oil and gas production of $42.4 per barrel of oil equivalent. This figure is 11% greater than the largest US banks and 22% greater than the top European banks.
| Bank(s) | Average Financed Breakeven Point ($/boe) |
|---|---|
| Scotiabank | 44 |
| TD | 43.1 |
| CIBC | 41.9 |
| BMO | 41.5 |
| RBC | 40.8 |
| Big 5 Canadian banks (total) | 42.4 |
| Top US banks (total)6 | 38.2 |
| Top European banks (total)7 | 34.7 |
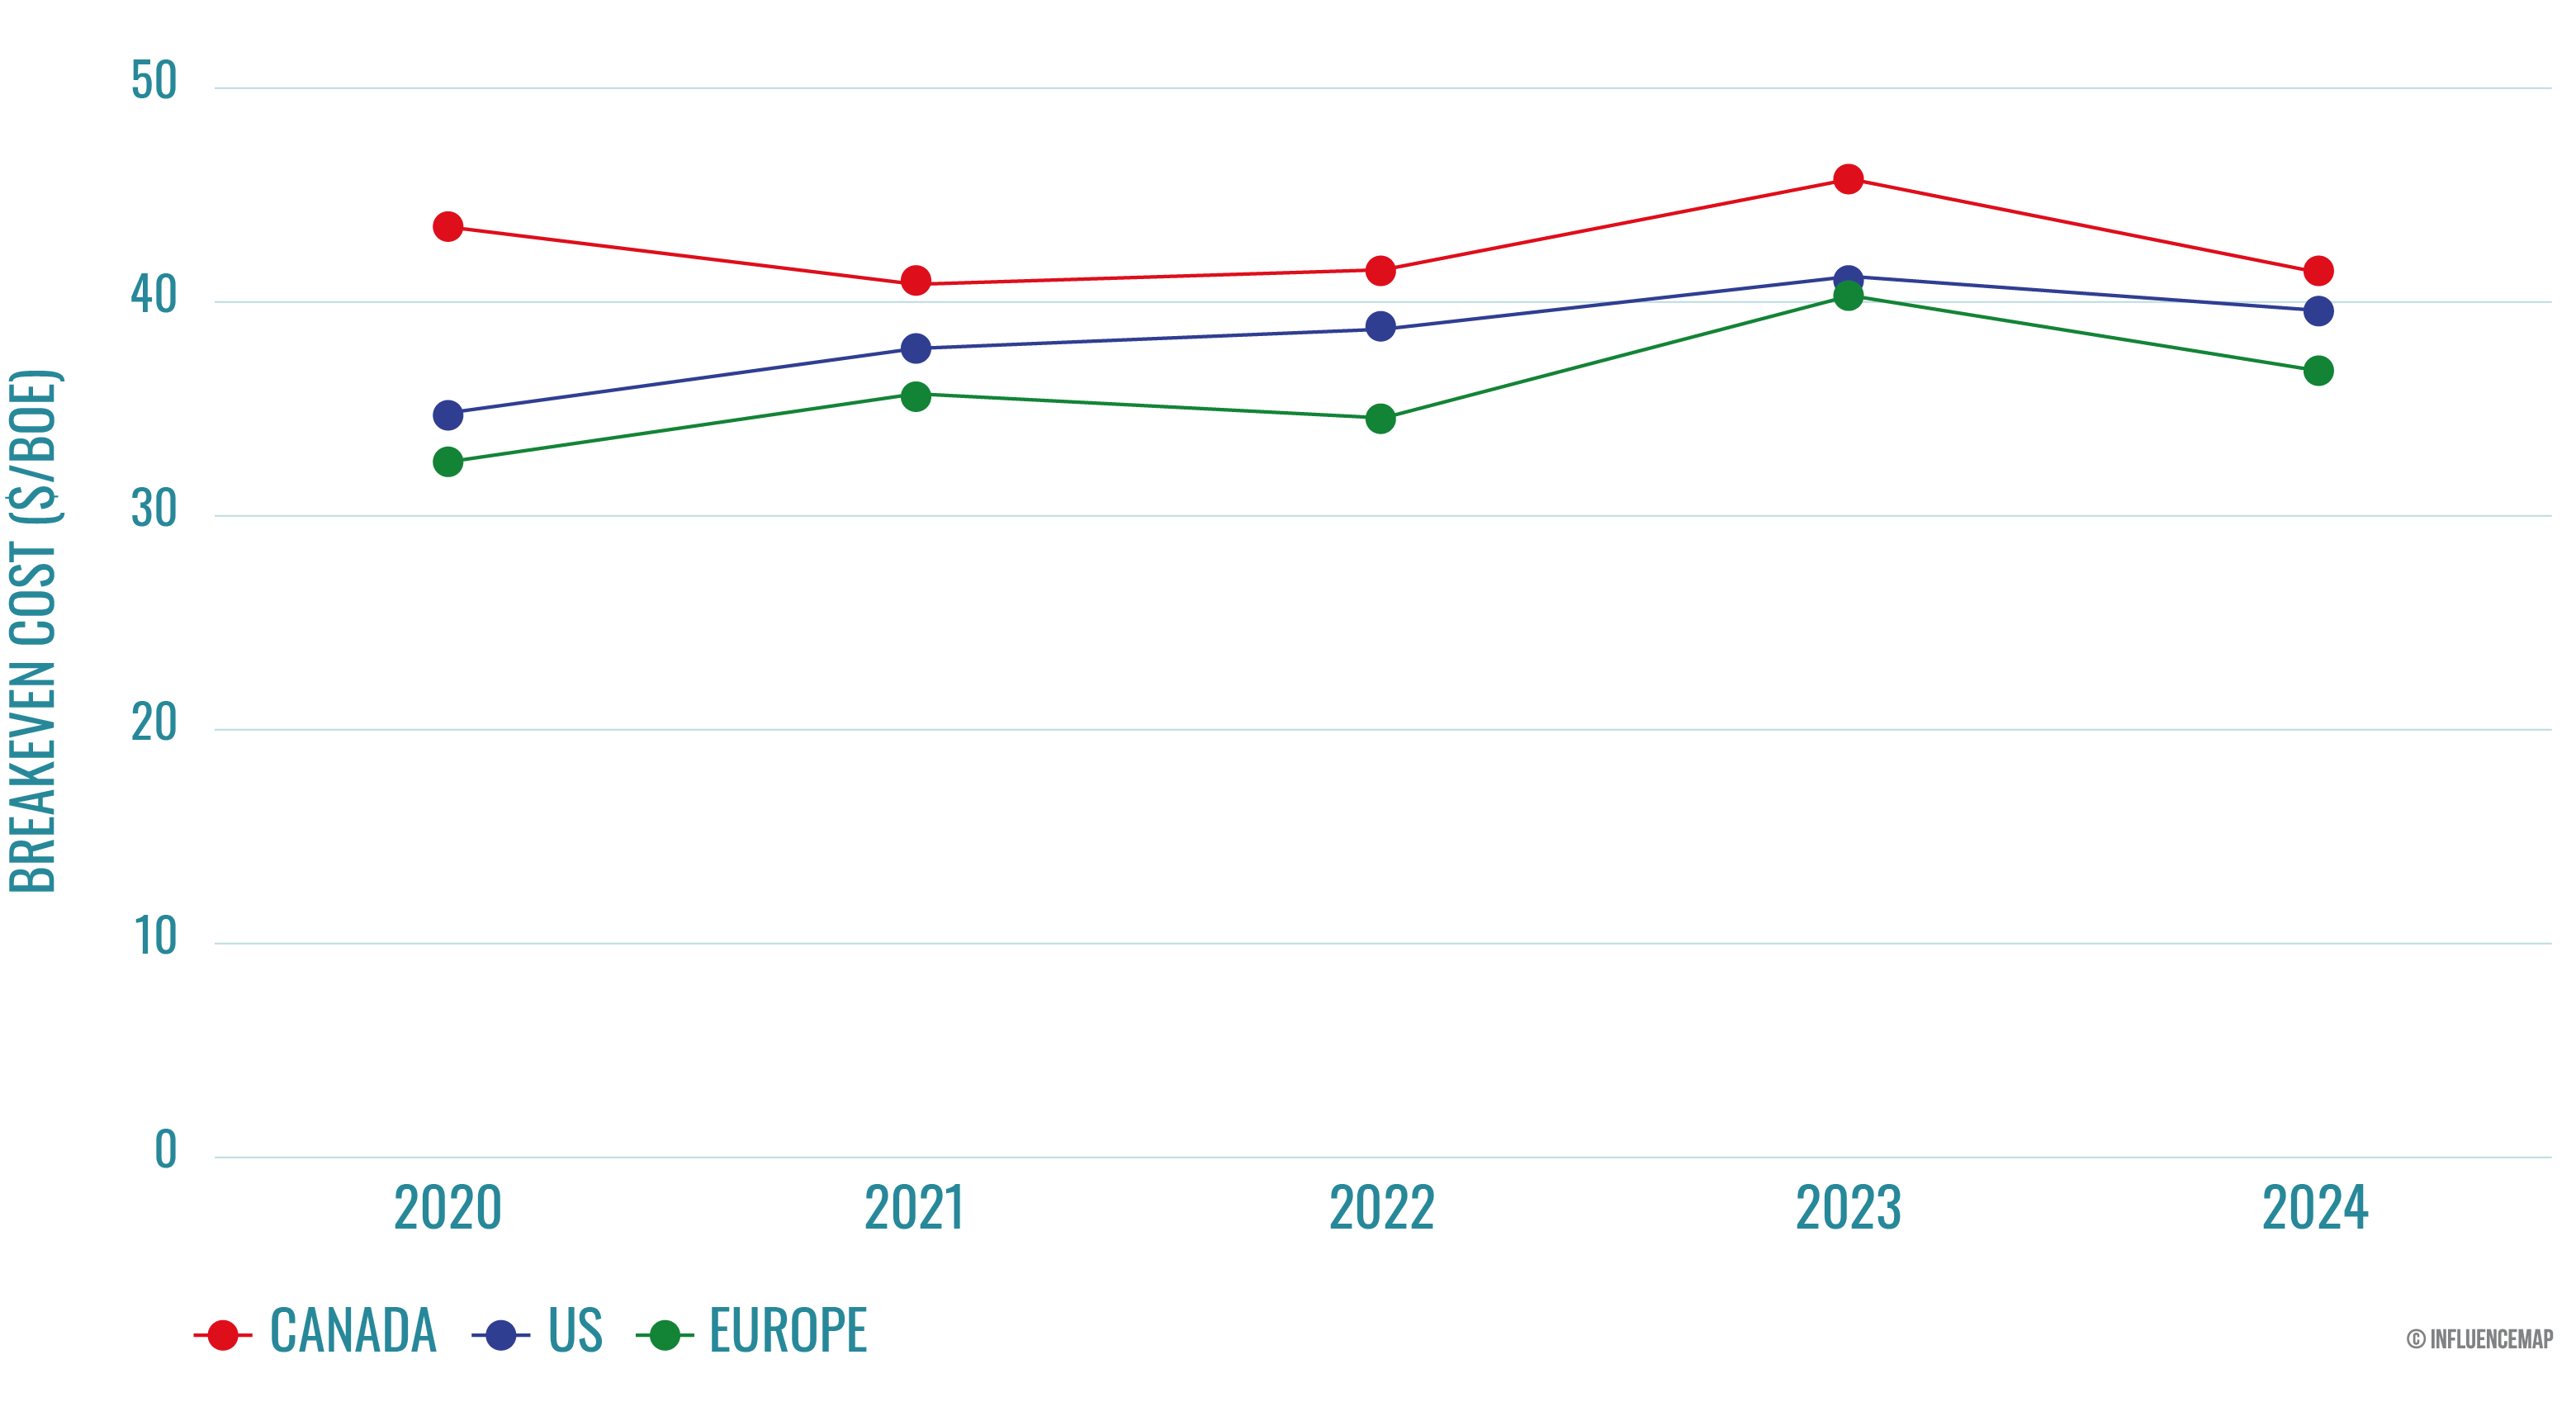
Figure 5 shows the evolution of each region’s banks’ average financed breakeven point of O&G production over the past five years. As shown, the Canadian Big Five have consistently financed oil and gas companies with higher average breakeven points than their US and European peers over the last five years.
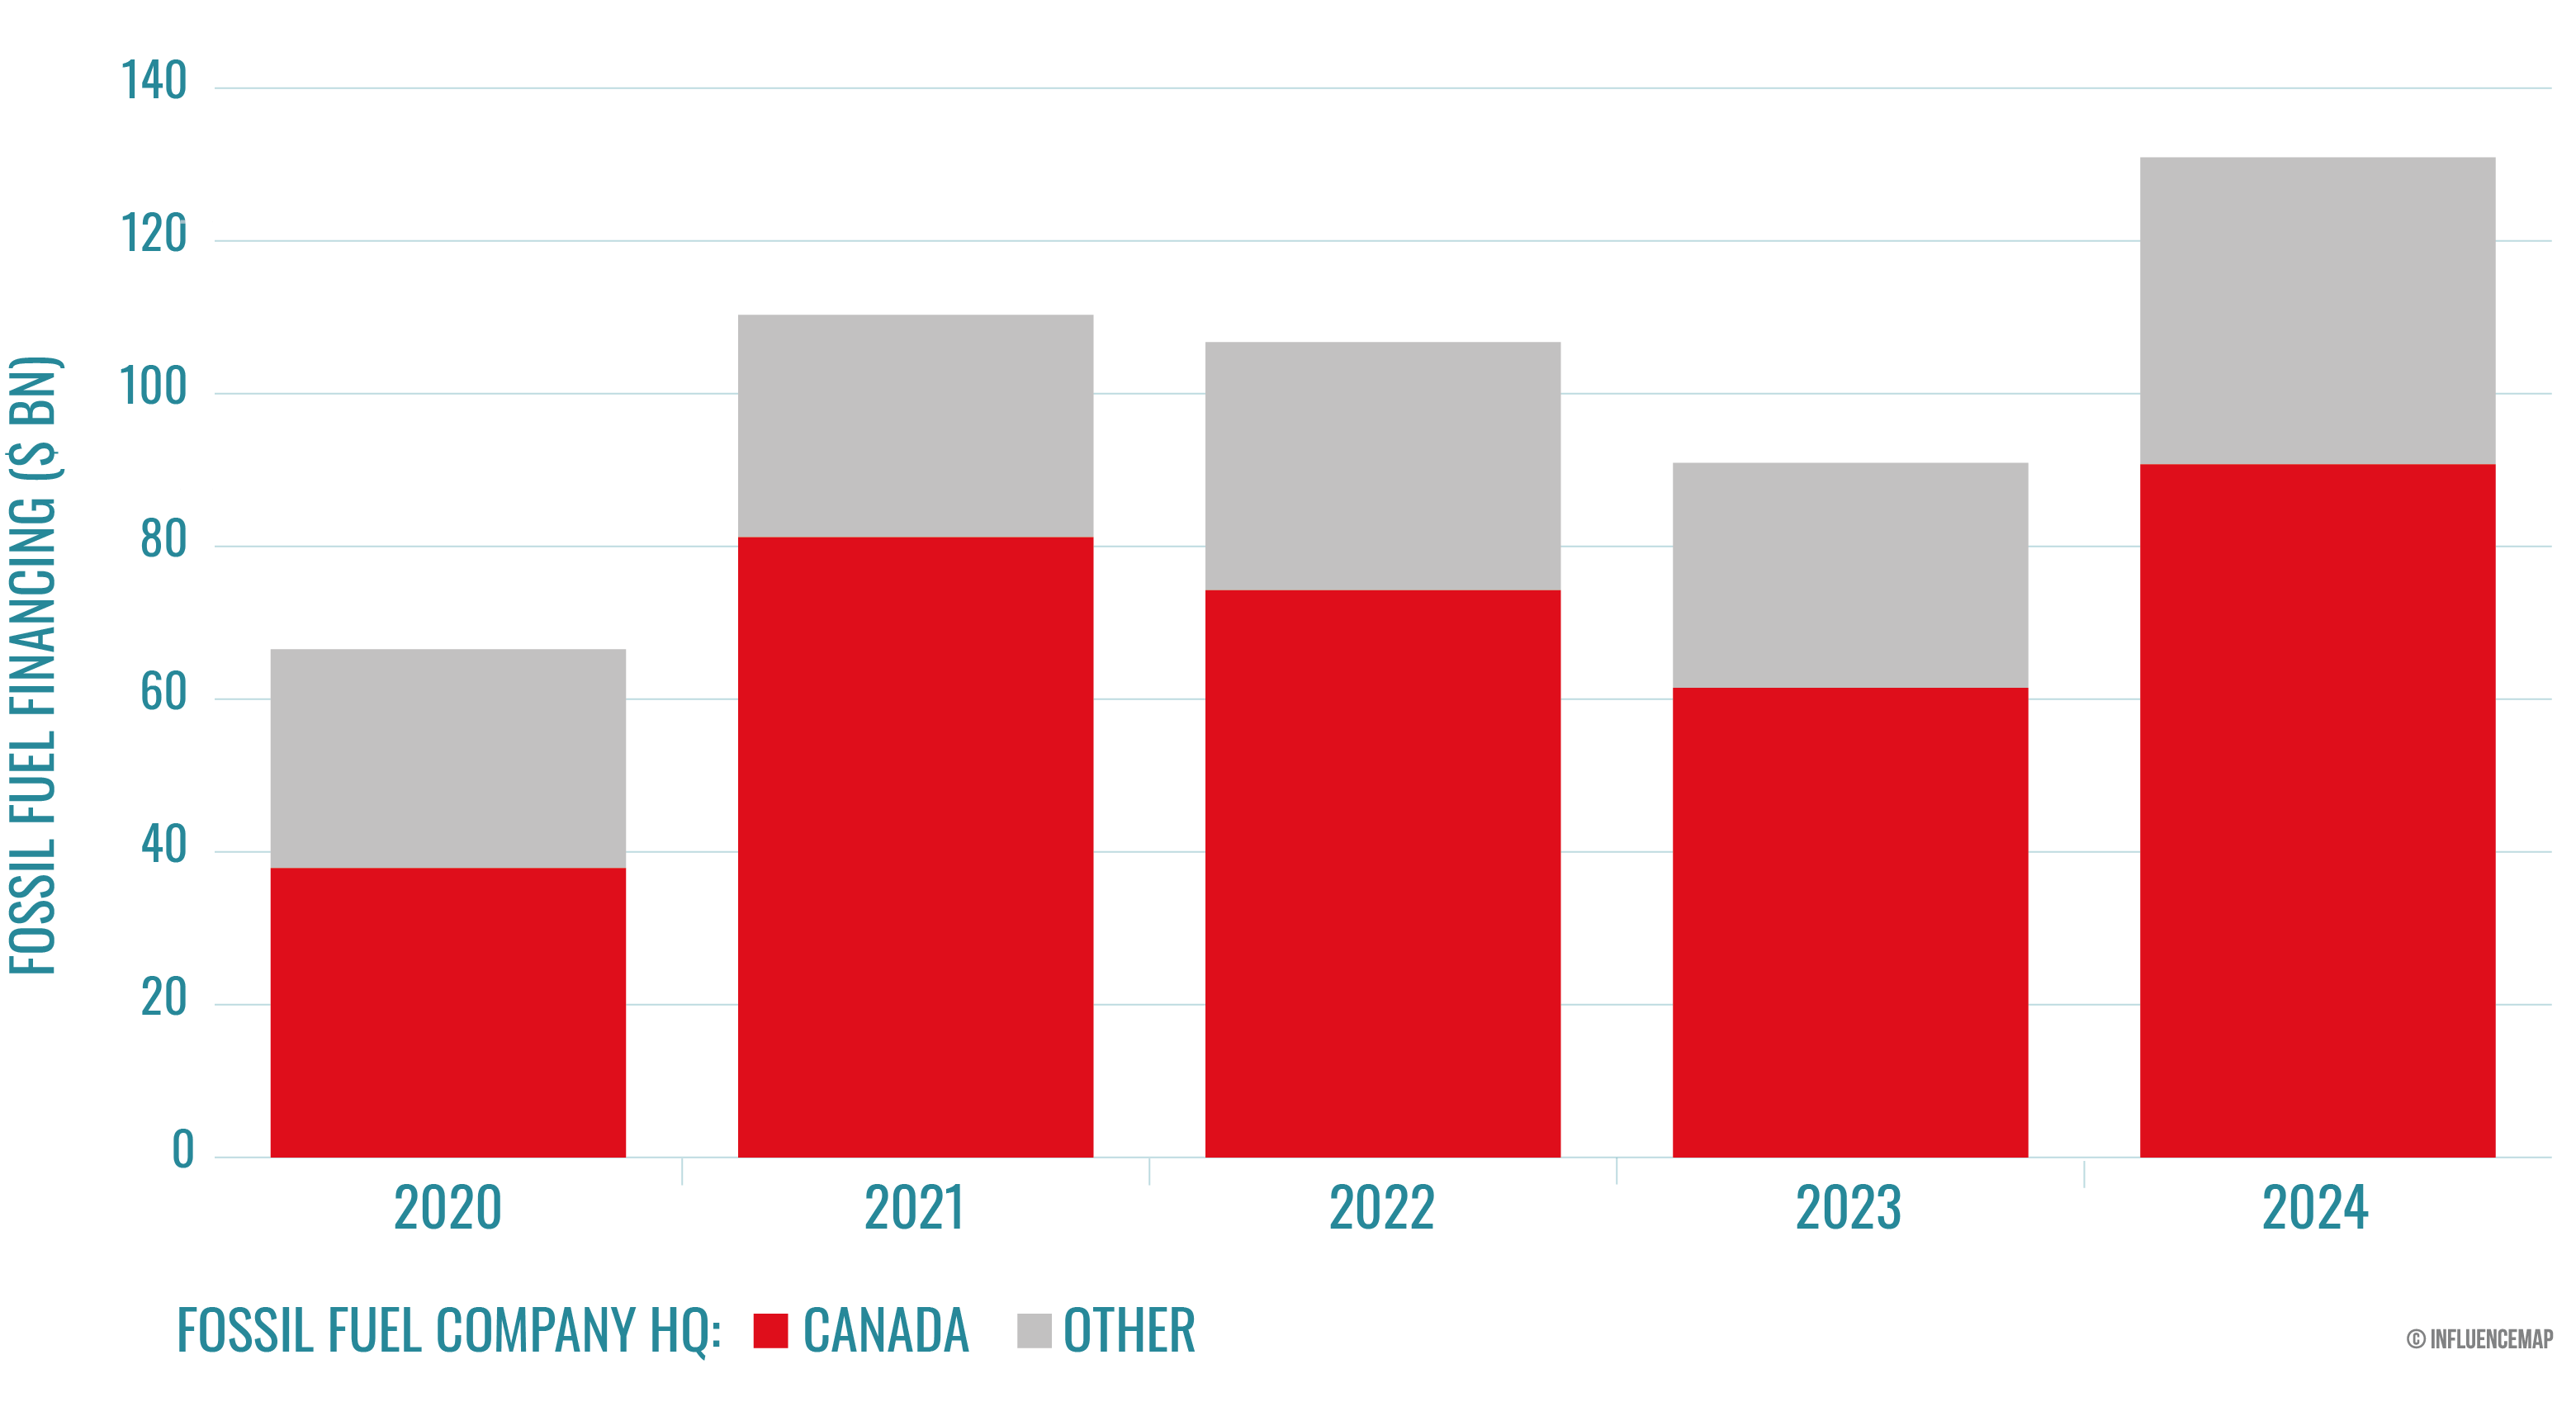
The Canadian Big Five’s financing to the fossil fuel sector over the past years primarily consisted of domestic deals, with Canadian fossil fuel companies receiving 68% of the total value of the banks’ financing to the fossil fuel sector between 2020 and 2024. Figure 6 shows the evolution of the Big Five’s financing to Canadian fossil fuel companies compared to total fossil fuel financing between 2020 and 2024.
Table 3 shows the average financed breakeven points for domestic versus other oil and gas companies in the Big Five’s deal books between 2020 and 2024. The table demonstrates that the Canadian banks’ exposure to the domestic oil and gas sector, which appears to have notably higher average breakeven points than in other regions, is a substantial driver of the banks’ high average financed breakeven point of oil and gas production. However, even the non-Canadian oil and gas companies financed by the Big Five appear to have higher average breakeven points than the companies financed by the US and European banks.
| Company HQ | Total Financing ($ bn) | Average Financed Breakeven Point ($/boe) |
|---|---|---|
| Canada | 345.6 | 43.4 |
| Other | 159.9 | 40.4 |
Table 4 shows the oil and gas companies that received the most financing from the Canadian Big Five banks between 2020 and 2024, alongside their average breakeven point of oil and gas production. All five companies are based in Canada, with very high average breakeven points.
| Company | Location | Total Deal Value ($ bn) | Average Breakeven Point ($/boe) |
|---|---|---|---|
| Enbridge | Canada | 33.4 | 52 |
| Cenovus Energy | Canada | 15.8 | 37 |
| Pembina Pipeline | Canada | 12.9 | 63 |
| Suncor Energy | Canada | 12.8 | 43 |
| Canadian Natural Resources | Canada | 11.8 | 37 |
For comparison, Table 5 and Table 6 show the top companies financed by the largest US and European banks, respectively. These companies have notably lower breakeven points than the companies financed by the Canadian banks.
| Company | Location | Total Deal Value ($ bn) | Average Breakeven Point ($/boe) |
|---|---|---|---|
| ExxonMobil | USA | 31.5 | 32 |
| Occidental Petroleum | USA | 28.8 | 40 |
| BP plc | UK | 23.1 | 27 |
| Diamondback Energy | USA | 15.9 | 33 |
| Aramco | Saudi Arabia | 13.3 | 34 |
| Company | Location | Total Deal Value ($ bn) | Average Breakeven Point ($/boe) |
|---|---|---|---|
| BP plc | UK | 24 | 27 |
| Shell | UK | 17.5 | 34 |
| TotalEnergies | France | 16.5 | 33 |
| Aramco | Saudi Arabia | 14.6 | 34 |
| Exxon Mobil | USA | 14.5 | 32 |
In its Paris Maligned III report, Carbon Tracker Initiative finds that Canadian oil sands firms Suncor and Cenovus and US shale producer Ovintiv have “the least competitive, and thus least climate-compatible,” forward-looking projects among the 30 large upstream oil and gas producers assessed.8 Meanwhile, data from the Carnegie Endowment’s Oil-Climate Index suggested that crude oil produced in Canada generated on average 3.1 times more greenhouse gas emissions per barrel from extraction and processing than the global average.9 The Big Five banks’ high exposure to domestic producers and generally high-breakeven companies indicates that Canada’s largest banks continue to finance companies which are more likely to become financially stranded when oil and gas demand falls, and prices with it, in a transition scenario. As such, the Big Five are substantially more exposed to transition risks than their global peers.
Table 7 shows each of the Big Five Canadian banks’ identified financing deal value to green companies in 2024 and their green exposure relative to their full assessed 2024 portfolio deal value. The same data is shown for the Big Five’s combined portfolios and for the combined portfolios of their largest peers in the US and Europe.
| Bank(s) | Green Financing ($ bn) | Green Relative Exposure |
|---|---|---|
| RBC | 7.8 | 0.036 |
| Scotiabank | 5.5 | 0.051 |
| BMO | 5.4 | 0.037 |
| TD Bank | 4.8 | 0.03 |
| CIBC | 4.4 | 0.051 |
| Big 5 Canadian banks (total) | 27.9 | 0.039 |
| Top US banks (total) | 52.3 | 0.02 |
| Top European banks (total) | 47.5 | 0.04 |
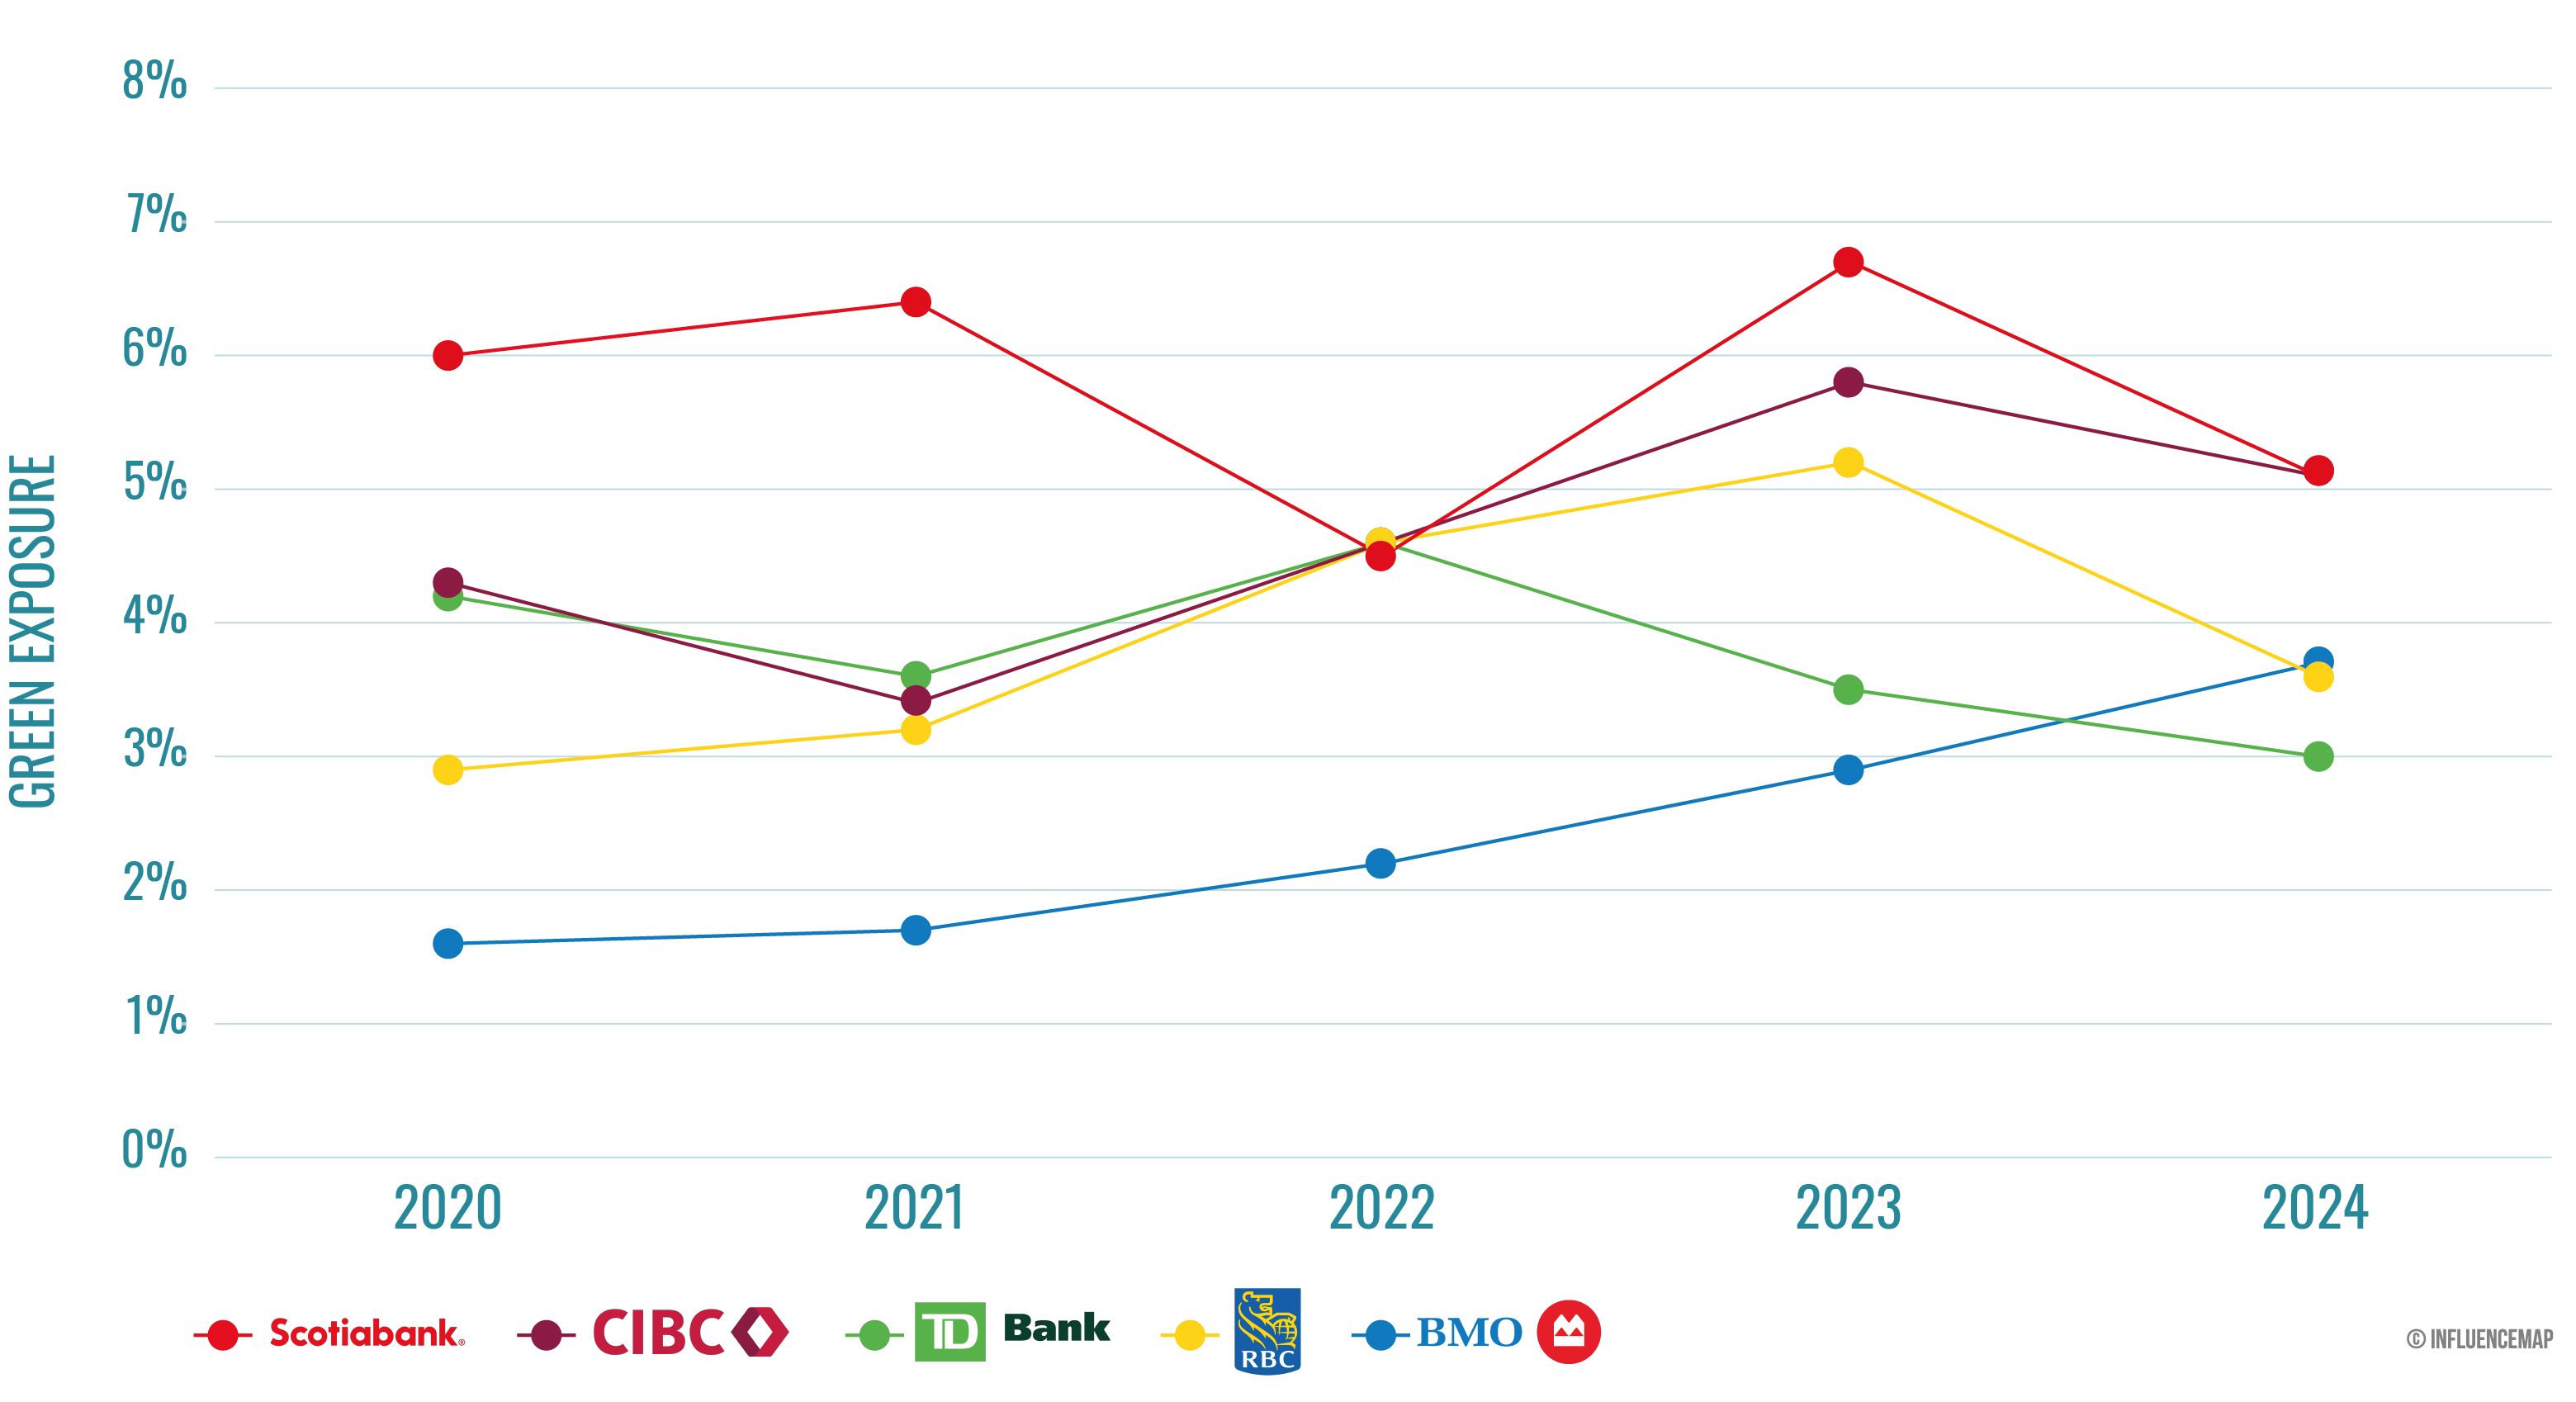
There is significant variation in the green financing among the Big Five, with Scotiabank and CIBC financing 5.1% of their total deal portfolios to green companies, while TD Bank sits at just 3.0%. Figure 7 shows the banks’ annual green exposures between 2020 and 2024.
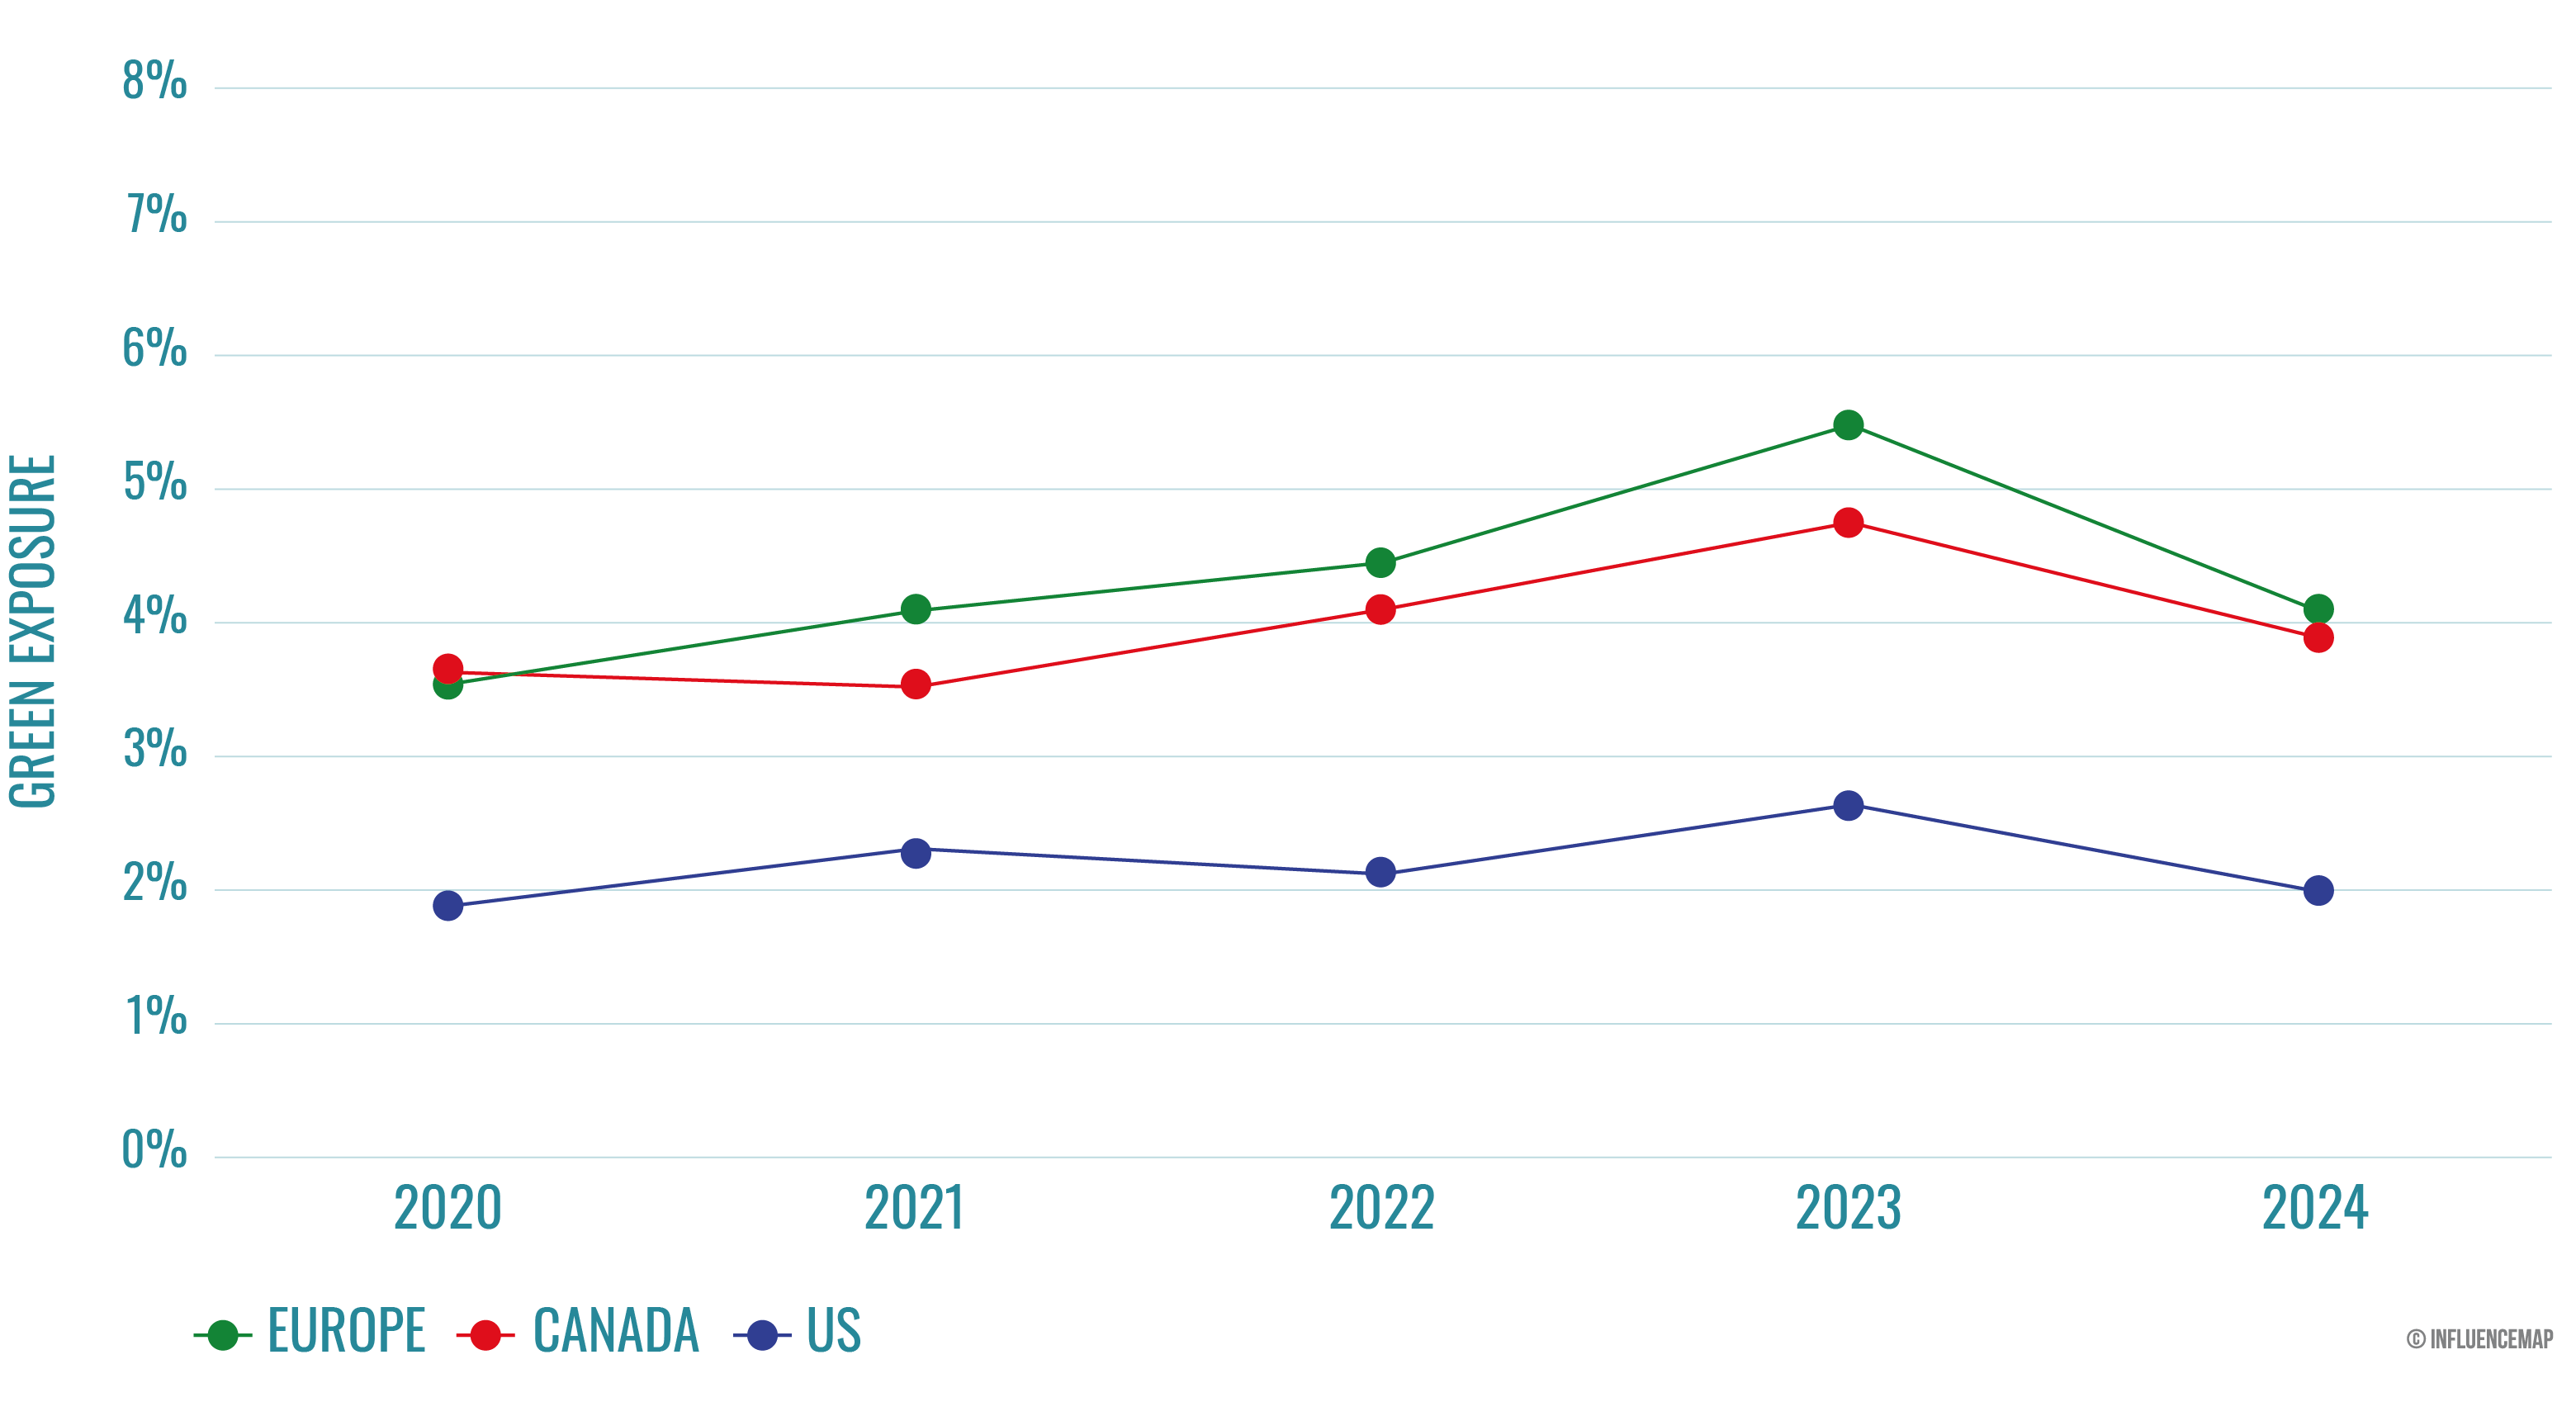
Cumulatively, the Canadian banks perform similarly on green exposure to their largest European counterparts and are considerably more exposed than the top US banks. This trend generally holds across the assessed 5-year period, as shown in the Figure 8. Notably, banks globally appear to have reversed a 2020–2023 upward trend in green financing in 2024.
According to BloombergNEF, every $1 invested in fossil fuel supply should be matched with four times as much investment in low-carbon energy supply globally by 2030 to achieve a 1.5°C scenario.10 However, Table 8 shows that the Big Five Canadian banks cumulatively financed just $0.21 to green companies for every $1 in deal value to fossil fuel companies in 2024.
| Bank(s) | Green to Fossil Fuel Financing Ratio |
|---|---|
| RBC | 0.27 |
| Scotiabank | 0.25 |
| BMO | 0.23 |
| CIBC | 0.21 |
| TD Bank | 0.13 |
| Big 5 Canadian banks (total) | 0.21 |
| Top US banks (total) | 0.26 |
| Top European banks (total) | 0.68 |
TD Bank had the lowest green to fossil fuel ratio of the five banks at 0.13:1, while RBC had the highest at 0.25:1. The Canadian banks’ green to fossil fuel financing ratios are also considerably lower than those of their global peers. Top European banks substantially outperformed their North American counterparts in 2024 by financing on average $0.68 to green companies for every $1 in financing to fossil fuel companies.
Figure 9 shows that while all three regions’ largest banks started at similar green to fossil fuel financing ratios below 0.3:1 in 2020, the top European banks drastically scaled up their financing of green companies relative to fossil fuel financing over the following years, leading to the significant difference between regions observed in 2024. Meanwhile, the largest US and Canadian banks’ green to fossil fuel financing ratios continued to linger below 0.3:1 in 2024. Nonetheless, all three regions appear far off track to meet the ratio of 4:1 by 2030 prescribed by BloombergNEF.
FinanceMap’s 2025 assessment of the five largest Canadian banks’ lending and underwriting activities finds a persistent high exposure to the fossil fuel sector and a lack of sufficient financing to green companies, both in absolute terms and relative to the banks’ global peers.
The research identifies $131 billion in financing by the Big Five to fossil fuel production companies in 2024 alone, representing 18.3% of the banks’ total 2024 financing. This number makes Canada’s Big Five banks over twice as exposed to the fossil fuel sector as the top US banks and over three times more exposed than the largest European banks. The Canadian banks also finance oil and gas companies with higher average breakeven points compared to their international counterparts. This is particularly true for the banks’ financing to domestic oil and gas companies, which make up most of the Big Five’s financing to the sector. These companies are far less competitive and thus less climate-aligned than their international peers, as their assets become financially stranded in a net-zero transition when declining oil and gas demand drives prices down. This appears to expose the Canadian banks to higher transition risks compared to their US and European counterparts.
Finally, the Big Five banks financed just $27.9 billion to green companies in 2024, equivalent to 3.9% of their total 2024 financing. This puts the Big Five at an average green to fossil fuel financing ratio of 0.21:1, substantially lower than their European peers at 0.68:1, and far below the trajectory required to meet global net-zero goals, estimated by BloombergNEF at a ratio of 4:1 by 2030.
In the absence of a significant shift away from high-cost fossil fuel financing and towards green alternatives, Canada’s largest banks are likely to remain significantly exposed to growing financial risks associated with the energy transition.